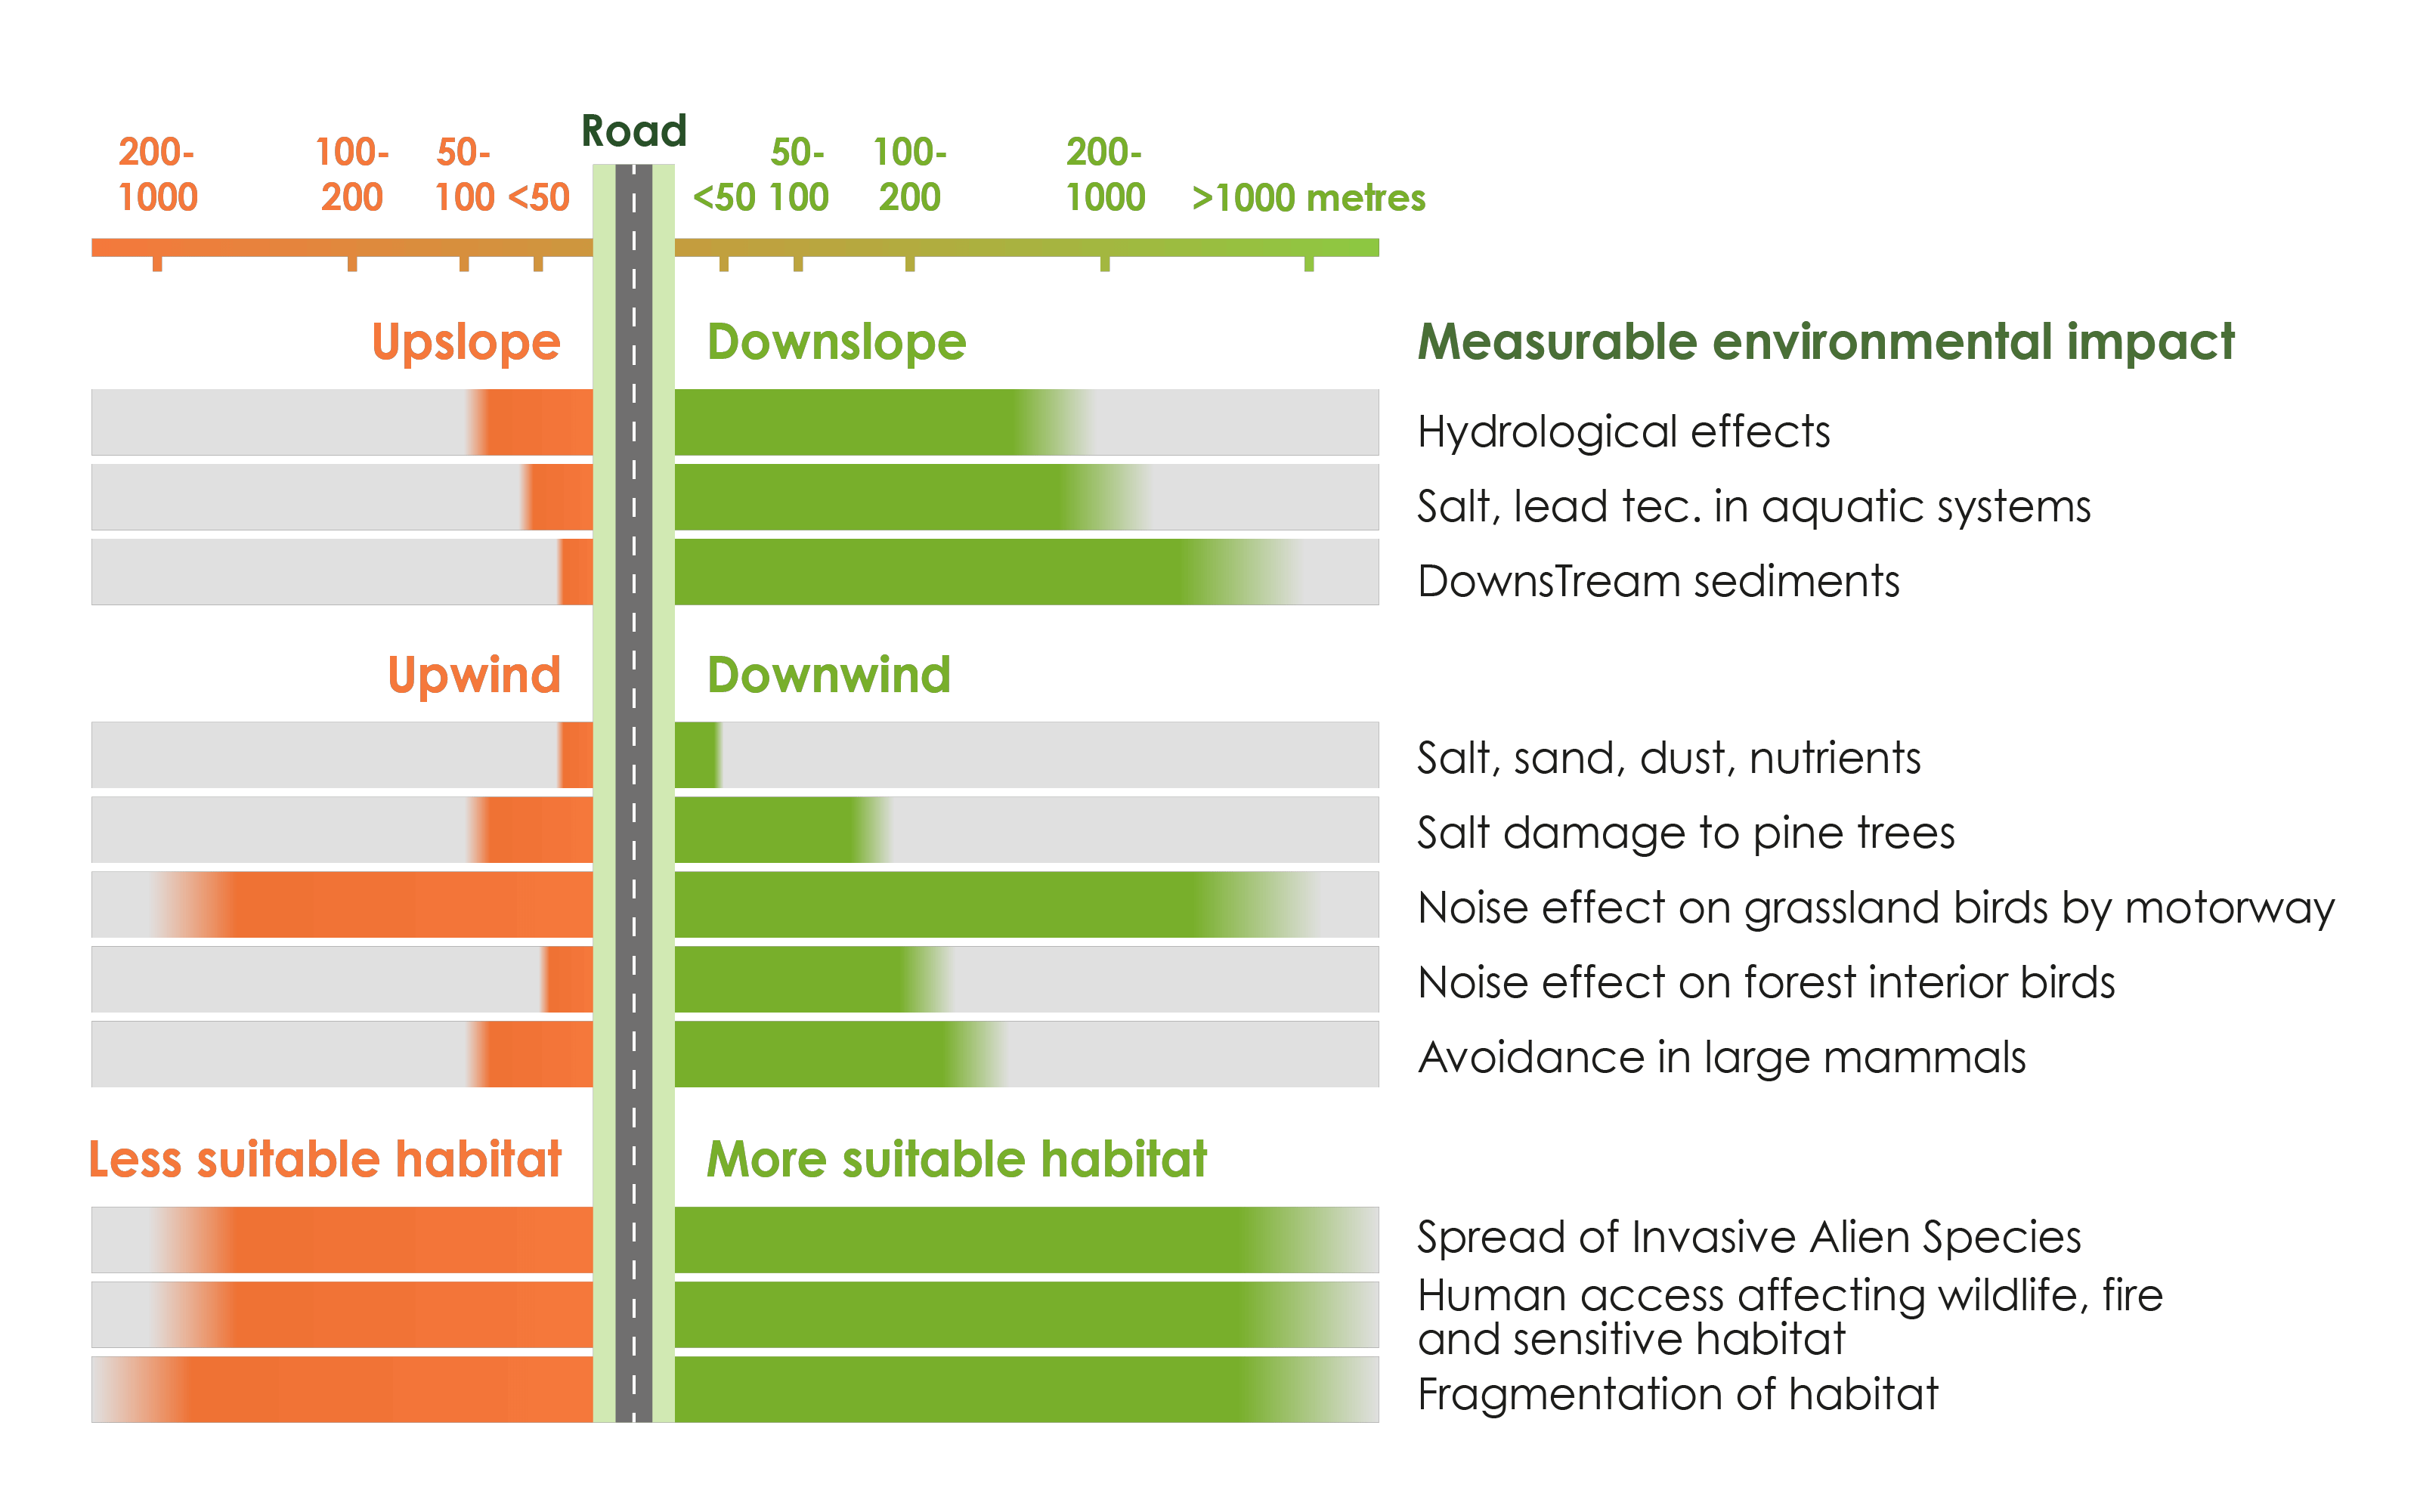
Construction, use and maintenance of transport infrastructure and associated areas have various impacts on surrounding ecosystems. They spread pollution (such as noise, light, chemical), change microclimate and groundwater flow, and help in propagating IAS. These impacts affect not only the habitats adjacent to infrastructure (such as road verges and embankments), but also the ecosystems and living conditions of wildlife and people in wider areas (Figure 1.3.10). The concept of the ‘effect zone’ (initially described for roads as ‘road effect zone’) captures these combined edge effects that extend beyond the infrastructure itself. The factors of disturbance contain,
- Chemical pollutants: de-icing salts, exhausts from combustion engines, nanoparticles from tyre and road abrasion, pesticides used in verge management.
- Physical perturbations: spread of dust, noise, light, strong scents from fuels changes in microclimate, spread of fires, altered ground water flows, increased erosion.
- Biological agents: spread of IAS, predators, human presence.
- Indirect effects on populations and ecosystems: changes in plant growth, changes in animal health, and reproduction (sink habitats), changed food webs and ecosystems, reduced biological productivity, reduced ecosystem services.

The extent of the ‘effect zone’ depends on multiple factors, such as the type, design, and traffic volume of infrastructure; the elevation, land cover, topography, hydrography, and prevailing wind direction in the surrounding area; as well as the traits and sensitivities of different species. While some physical and chemical pollutants from infrastructure surfaces and vehicles accumulate in the nearby adjacent areas, others may be transported far downstream or downwind from the source of pollution. Noise and light disturbances may spread farther into surrounding habitats, and biological agents as well as the consequences to populations caused by reduced health, lower survival and reproductivity may matter at even greater distances. Some species may experience edge effects several kilometres away from infrastructure.
Some effects can be expected to diminish gradually with increasing distance (e.g., deposition of dust and salt from roads), while others may exhibit thresholds in the responses of species (e.g., noise effects on breeding birds, light effects on bats). Overall, the combined impact follows a negative exponential curve with the strongest combined effects in the immediate vicinity (~ 100 m) to infrastructure and fewer impacts extending far (~ kilometres) into the surrounding landscape. Quantifying this curve and defining the nature of the ‘effect zone´ can be a very helpful approach that empowers planners to better assess the area that is impacted by existing or new infrastructure and relate this to the need for mitigation (Chapter 3 – The mitigation hierarchy).
Examples of edge effects include the effects of de-icing salts on verge vegetation, the fertilising effects of vehicle exhausts, the effect of heavy metals from fuel additives on amphibian populations, the contamination of run-off waters and consequent pollution of aquifers, but also the disturbance by traffic noise on breeding birds and their vocal communication, or the influence of street illumination on insect fauna and the behaviour of predators, such as bats (see Chapter 5 – Solutions to mitigate impacts and benefit nature).
Many of these edge effects must be addressed and managed by the infrastructure operators while others refer to infrastructure users and are regulated through laws and policies that limit the production of the polluting agents. For example, legal tools have successfully limited the use of heavy metals in engine fuels, of de-icing salts in winter road maintenance, the use of glyphosates in vegetation control along railway tracks, or the use of Metal Halide (cold) streetlights, or the pollution by traffic noise in urban environments.
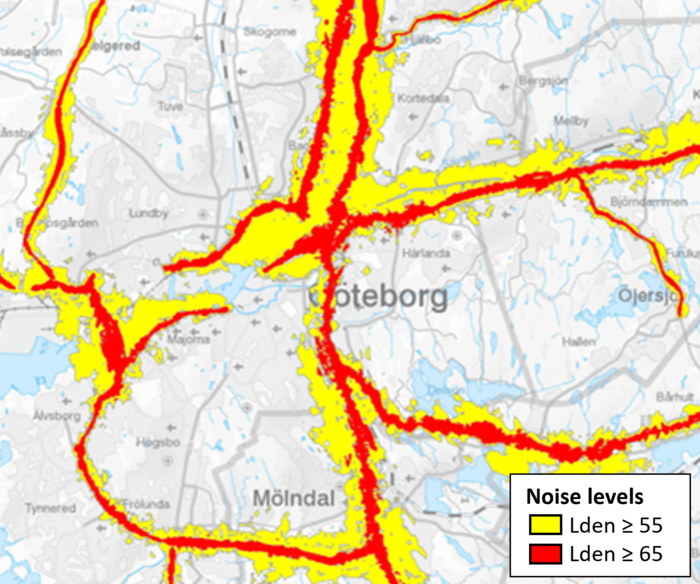
Traffic noise is recognised as a growing human health problem in urban environments. Frequent exposure to noise may cause sleep disturbances, cognitive effects, and physiological stress reactions, leading to an estimated 10,000 premature deaths annually in Europe. Noise distribution maps can be modelled using tools such as CNOSSOS-EU (Figure 1.3.11). Where noise exceeds 50 dB at night, the European Commission’s zero pollution plan demands mitigation. Similarly, traffic noise is responsible for the decline of breeding bird populations near roads as noise significantly lowers reproductive success and survival. Sensitivity thresholds in birds appear to be similar to those in humans (~ 50 dB). Thus, the same noise standards could be applied to both cities and natural areas with sensitive breeding birds.
Infrastructure managers may often have only limited possibilities for control and must seek to contain pollution within the infrastructure corridor. Traffic noise and traffic light can be absorbed by protective screens, earthen mounds, or dense vegetation, while run-off water from roads can be captured in retention ponds where it is decontaminated, and micro-particles can sediment before reaching aquifers (see Chapter 5 – Solutions to mitigate impacts and benefit nature).
Mitigating edge effects places a special emphasis on design and management of infrastructure verge habitats and other facilities that separate transport facilities from the surrounding landscape (see Chapter 5 – Solutions to mitigate impacts and benefit nature). These areas play an important role in providing nature-based solutions that may reduce the spread of pollutants, even including biological agents such as IAS.
